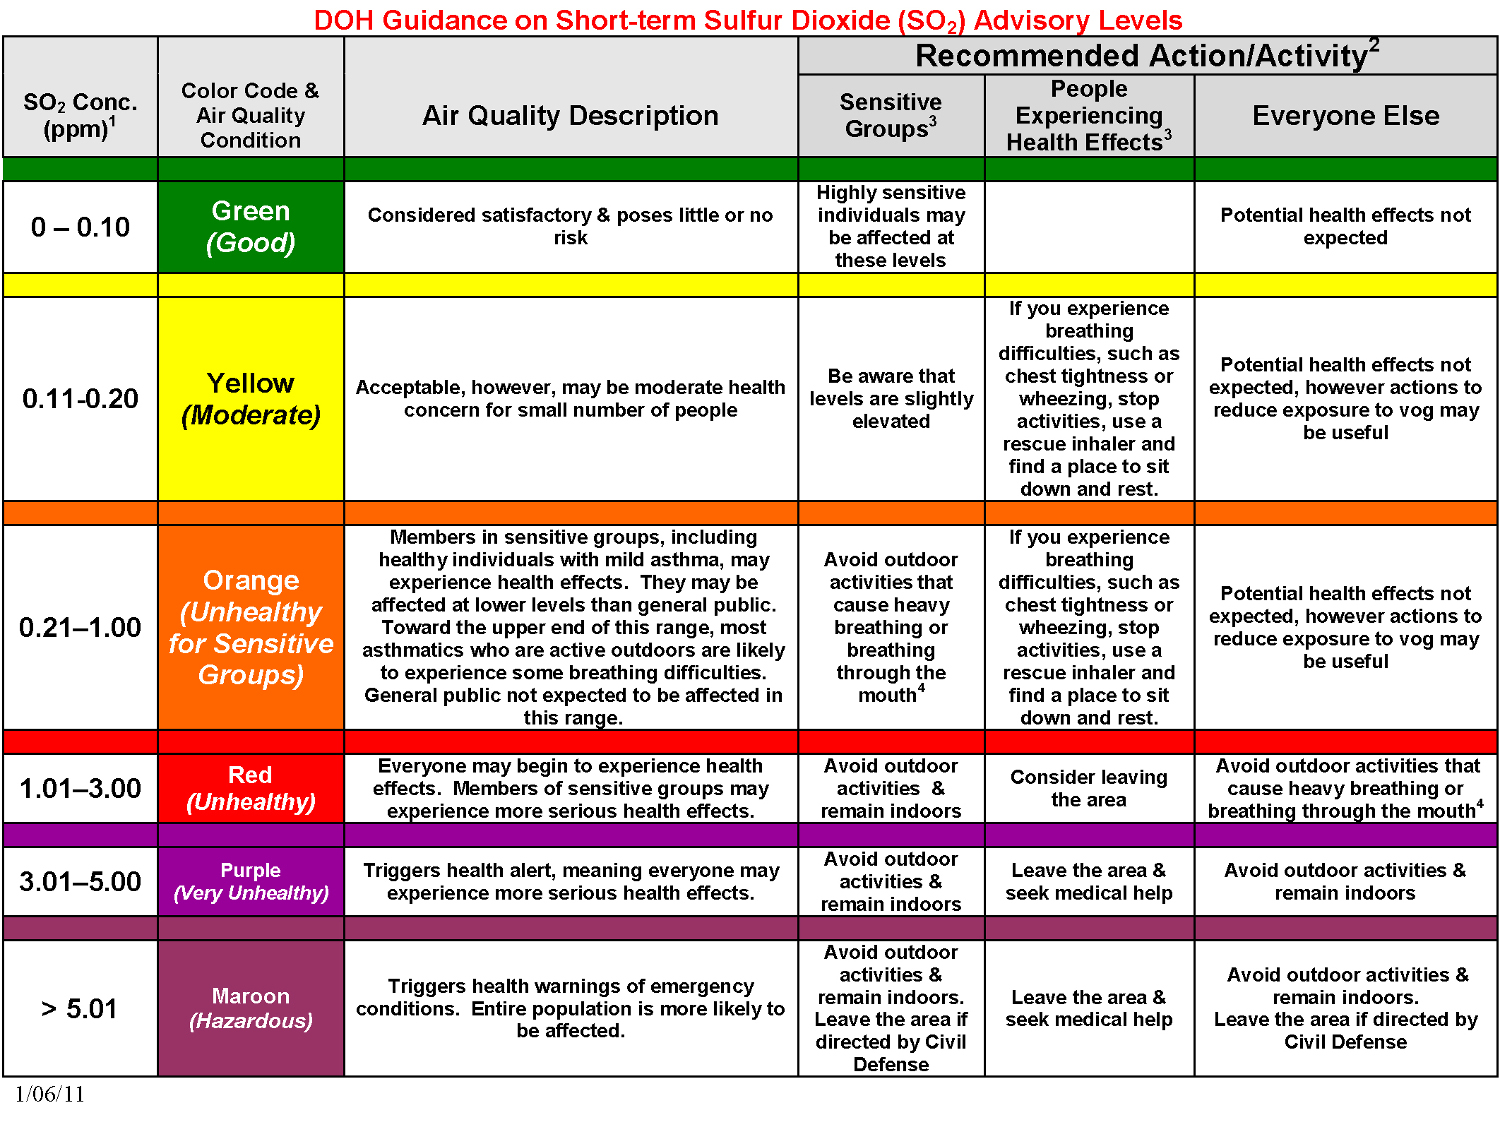
The “Short-term Sulfur Dioxide Advisory Level Information” table uses a six-tiered color-coded system to depict sulfur dioxide (SO2) concentrations and provide guidance for different groups of people exposed to SO2. Graphic courtesy of the State of Hawaii Department of Health.
(BIVN) – Kīlauea is not erupting and monitoring data have shown no significant changes over the past week, the U.S. Geological Survey Hawaiian Volcano Observatory reports. “Sulfur dioxide emission rates are low at the summit and below detection limits at Pu‘u ‘Ō‘ō and the lower East Rift Zone,” the scientists wrote in the monthly update.
Air quality was the topic of the latest Volcano Watch article, written every week by USGS HVO scientists and affiliates. Today’s article is by colleagues with the State of Hawaii Department of Health:
Hawaii State Department of Health updates Ambient Air Quality Data website
Information about air quality is important to Hawaii residents, particularly those living on the Island of Hawaiʻi, where volcanic activity can lead to frequently-changing environmental conditions. To better inform residents and visitors about current air quality conditions, the State of Hawaii Department of Health (DOH) Clean Air Branch has updated the Hawaii Ambient Air Quality Data website, which is best viewed using the Google Chrome browser.
The goal of the updated website is to provide near real-time statewide air quality data online. The website has proven useful to island residents and visitors, as well as state and county officials, all of whom now have a one-stop online resource for DOH air quality information. This resource will be especially useful during future eruptions.
Data for the website is pulled from 17 air quality monitoring stations throughout the state, 10 of which are on the Island of Hawaiʻi. This includes six new long-term stations located at Hōnaunau, Kailua-Kona, Keaʻau, Nāʻālehu, Waikoloa, and a soon-to-be reestablished Pāhoa station. Implementation of this expanded monitoring system was a collaborative initiative between the DOH Clean Air Branch and State Laboratories Division.
Different air pollutants are measured at each of the 17 locations. All Hawaiʻi air monitoring stations measure small particulate matter (PM2.5), and most stations measure sulfur dioxide (SO2).
PM2.5 and SO2 emissions increase during eruptions and are the key contributors to vog (volcanic air pollution). Other measured pollutants include chemicals frequently found in anthropogenic (human-caused) air pollution, including large particulate matter (PM10), carbon monoxide (CO), ozone (O3), and nitrogen dioxide (NO2). Website users can sort data by pollutant or location.
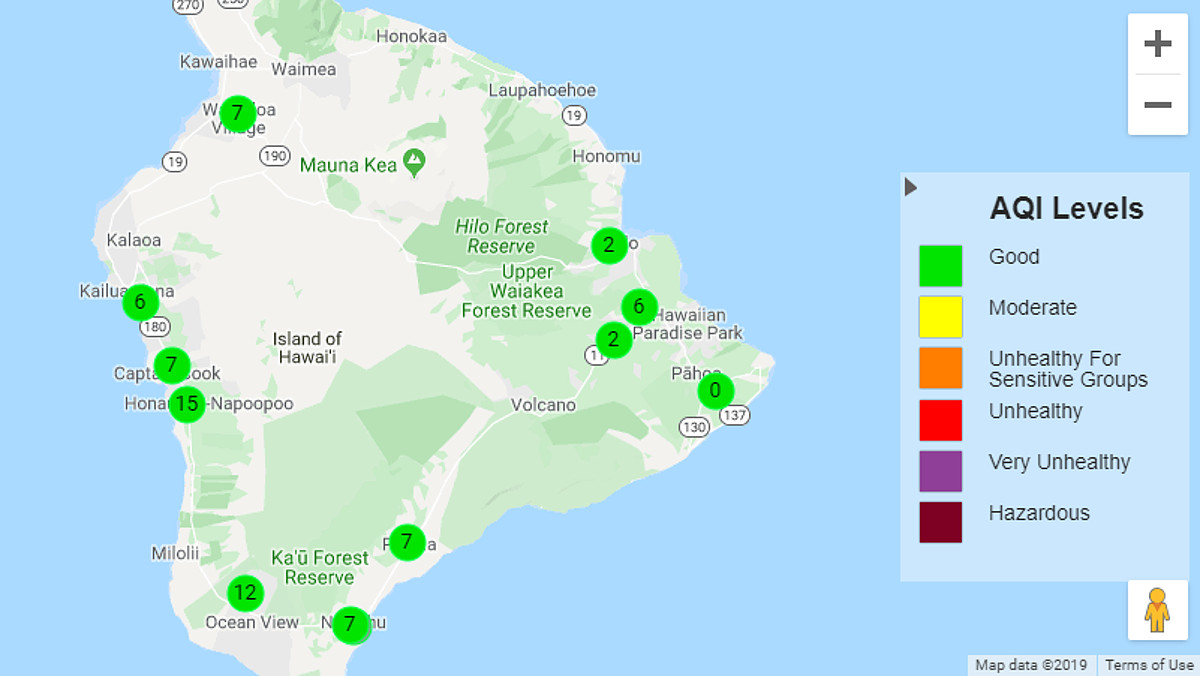
The opening page of the website displays Air Quality Index (AQI) values for each air monitoring station. The AQI is a national standard that indicates how clean or polluted the air is using a six-tiered color-coded system: good (green), moderate (yellow), unhealthy for sensitive groups (orange), unhealthy (red), very unhealthy (purple), or hazardous (maroon). It also provides information on associated health effects and who may be affected at each level.
The AQI is a calculated number based on the concentration of the pollutant in the air. The higher the AQI value, the greater the air pollution level and the greater the health concern.
Values shown on the website are for the pollutant with the highest AQI for the respective site. To view current and previous AQIs in a graphical format, click on a specific station. To display AQI values for a specific pollutant, select from pollutants listed below the “Air Quality Index” tab.
Average hourly concentrations for each monitored pollutant (PM10, PM2.5, SO2, CO, O3, and NO2) can be viewed by selecting “Pollutant” in the “Air Quality Index” dropdown menu. Select the pollutant of interest to display hourly concentrations in parts per million (ppm) or micrograms per cubic meter (µg/m3). This data is available in both map and table formats. To access the table format, click on “Hourly Monitoring Data” under the “Reports” tab.
Hawaiʻi Short Term SO2 Advisory data can be viewed by selecting “SO2 Advisory” from the “Current Air Quality” tab. Unlike the main webpage, which provides average hourly concentrations, the “SO2 Advisory” page provides 15-minute SO2 average concentrations in ppm and displays corresponding color-coded advisory levels based on specific DOH guidance for short-term SO2 exposure. The DOH guidance uses the same six-tiered color-coded structure and contains recommended actions for different groups according to SO2 concentration levels—summarized in the attached table.
The website’s “Health” tab provides information related to health effects from air pollution and vog, as well as information about the AQI. Another useful tool on the website is the ability to generate reports of historical air quality data for a chosen time period filtered by station or pollutant.
Hawaii residents and visitors are encouraged to visit the DOH Hawaii Ambient Air Quality Data website to keep informed about changing air quality conditions and to use posted links to available resources to learn more about air pollution and its impacts on health. Additional resources related to air quality and volcanic emissions include the Hawaii Interagency Vog Information Dashboard and the USGS Hawaiian Volcano Observatory.


by Big Island Video News5:51 pm
on at
STORY SUMMARY
HAWAIʻI ISLAND - Data is coming in from six new long-term stations located at Hōnaunau, Kailua-Kona, Keaʻau, Nāʻālehu, Waikoloa, and a soon-to-be reestablished Pāhoa station.