PUNA, Hawaii – A lava lobe on the northern edge of the June 27th flow field is slowly moving downhill, but scientists say it currently poses no threat to nearby communities.
The USGS Hawaiian Volcano Observatory reports today that the webcam on Puʻu ʻŌʻō shows small breakouts scattered across the flow field in the distance to the northeast of the cone, where they’ve been occurring for the last several months.
USGS mapped the flow field on March 25. Observations from that day found the most distal lava breakout to be 4.7 miles northeast of Puʻu ʻŌʻō.
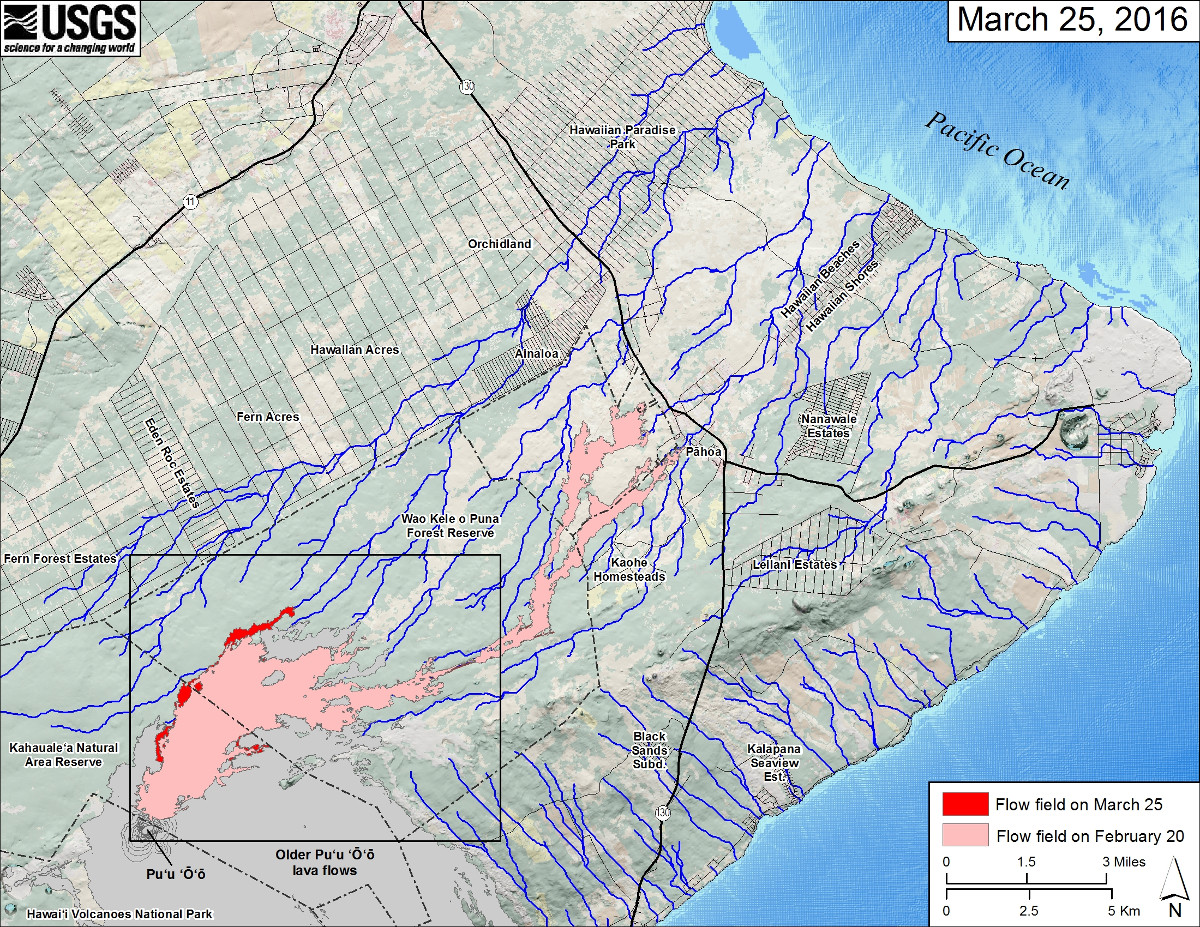
USGS MAP: This small-scale map shows Kīlauea’s active East Rift Zone lava flow field in relation to the eastern part of the Island of Hawaiʻi. The area of the flow field on February 20 is shown in pink, while widening and advancement of the flow field as mapped on March 25 is shown in red. Puʻu ʻŌʻō lava flows erupted prior to June 27, 2014, are shown in gray. The black box shows the extent of the accompanying large scale maps. The blue lines show steepest-descent paths calculated from a 1983 digital elevation model (DEM). Steepest-descent path analysis is based on the assumption that the DEM perfectly represents the earth’s surface. DEMs, however, are not perfect, so the blue lines on this map can be used to infer only approximate potential flow paths. The base map is a partly transparent regional land cover map from National Oceanic and Atmospheric Administration (NOAA) Office of Coastal Management draped over a 1983 10-m digital elevation model (DEM). The bathymetry is also from NOAA.
The map shows the lava lobe is following a line of deepest descent towards Hawaiian Acres. At the rate its going there’s no reason for alarm yet, USGS HVO geologist Tim Orr told the Hawaii Tribune-Herald last week. Orr said the advancing lava lobe was something scientists are watching, but it would need to capture more of the overall flow activity in order to be more concerning. Right now, the activity is scattered across the flow field and has not organized in any one direction for too long. There is always a chance the eruptive pattern will change before the flow becomes a threat, as well.
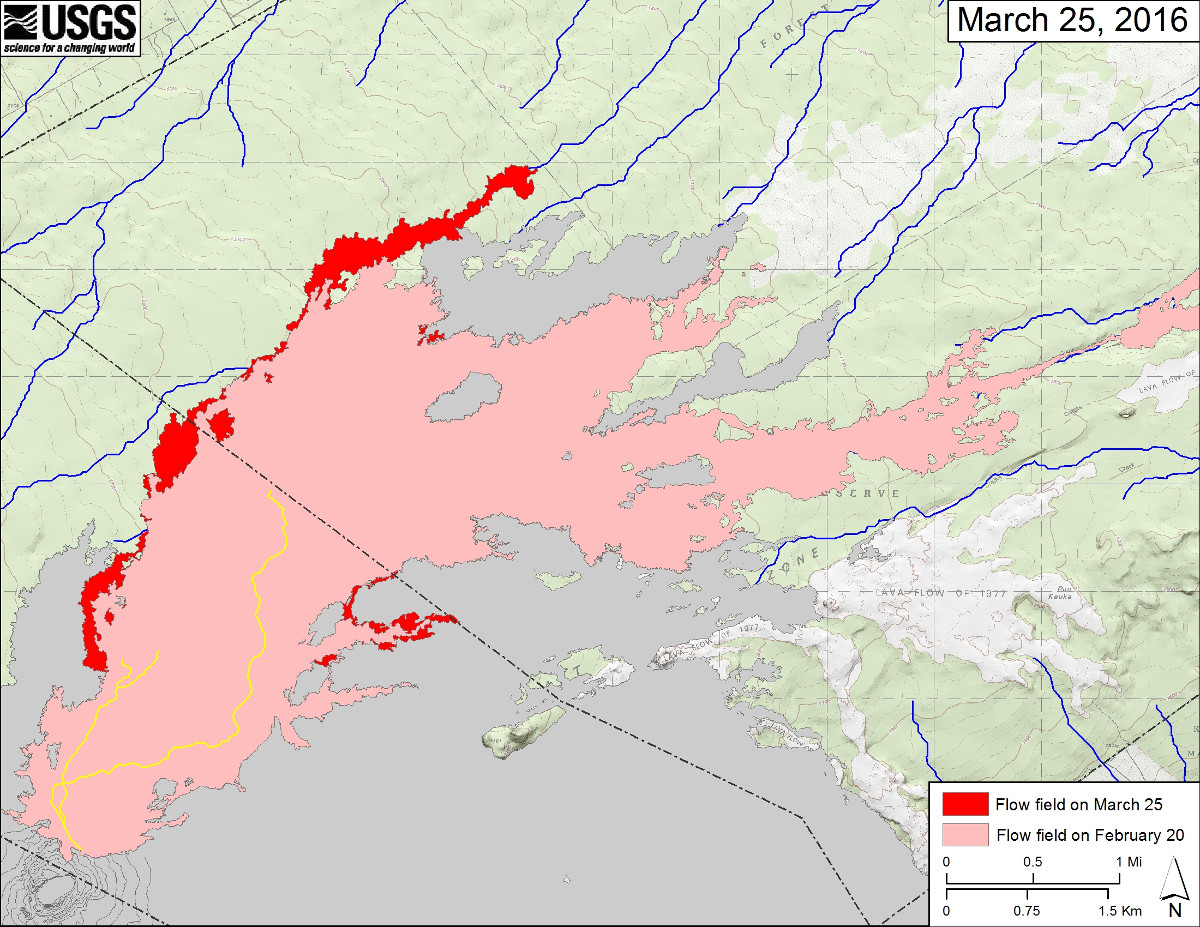
USGS MAP: This large-scale map of flow field is an inset of the map posted above.
The flow began on June 27 when a new vent opened on the Puʻu ʻŌʻō cone, sending flows that eventually threatened the town of Pahoa in the fall of and winter 2014. But the portion of the lava flow that was burning its way into town died off, and the flow has since remained active upslope, far from populated areas. The alert level for Kilauea volcano has been at “Watch” since March 25, 2015, when USGS downgraded it from “Warning”.
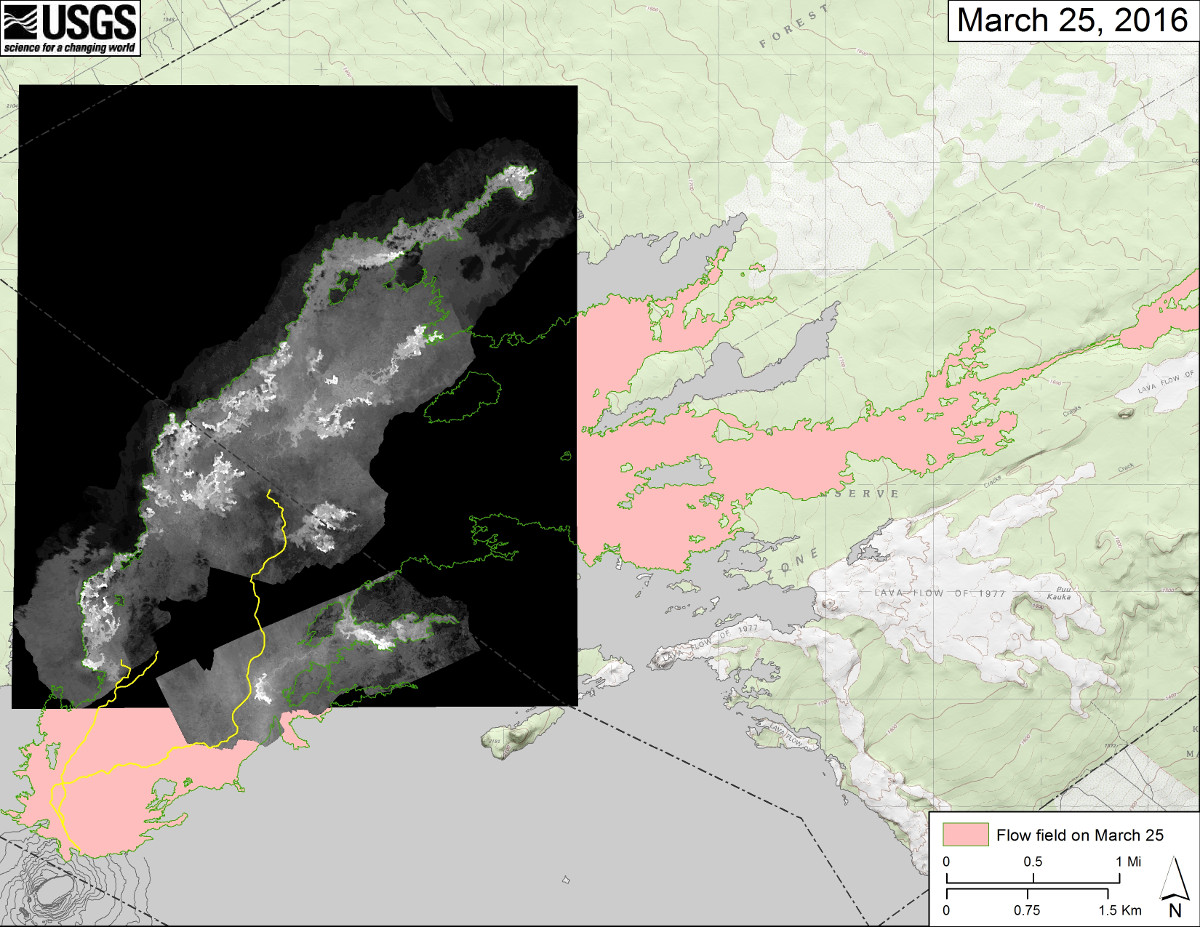
USGS MAP: This map overlays a georeferenced thermal image mosaic onto the current map of the flow field near Puʻu ʻŌʻō to show the distribution of active and recently active breakouts. The thermal images were collected during a helicopter overflight on March 25. The June 27th flow field as of March 25 is outlined in green for comparison. The yellow lines show the active lava tube system, as currently mapped. Puʻu ʻŌʻō is at lower left.

by Big Island Video News
on at
STORY SUMMARY
PUNA - A lava lobe is making slow progress down a line of deepest descent, but currently poses no threat to nearby communities.