(ABOVE VIDEO) Audio of Hawaii County Civil Defense administrator Darryl Oliveira from an October 13 media conference call. Images from USGS Hawaiian Volcano Observatory overflight on October 13.
NEWS BRIEFS
- The leading edge of the lava flow is now about 0.7 miles “straight-line distance” from Apa`a Street, according to an evening Volcanic Activity Notice posted by the USGS Hawaiian Volcano Observatory.
- At the average rate of advancement of 81 yards per day since October 6, the lava could reach Apa`a Street in about 19 days, or November 1st.
INSIGHTS
Hawaii County Civil Defense will have to split their attention between the lava flow and the possibility of a hurricane that could arrive by the weekend. Civil Defense admin Darryl Oliveira spoke about the preps for Tropical Storm Ana during the same media conference on Monday.
PRIMARY SOURCES

Volcanic Activity Summary: The June 27th flow remains active, with the flow front having advanced downslope about 218 m (238 yd) since October 10. Breakouts are mainly scattered across the leading 2.1 km (1.3 mi) of the flow, and midway along the length of the flow where lava first entered the crack system. A few other small breakouts were active along the flow between these two main areas of activity. The flow front is 1.4 km (0.9 mi) upslope from Apa`a St. along the steepest descent path and 1.1 km (0.7 mi) upslope from Apa`a St. along a straight line. At the average rate of advancement of 74 m/day (81 yd/day) since October 6, the lava could reach Apa`a St. in about 19 days (November 1). The advance rate of the June 27th flow has varied significantly during the past month and week, meaning this projection is subject to change. Our next overflight is scheduled for Wednesday, October 15.
Pāhoa town is in the Puna District of the County of Hawai`i.
Recent Observations:
[Lava flow] The June 27th lava flow has advanced at an average rate of 74 m/day (81 yd) since October 6. The leading edge is now about 1.1 km (0.7 mi) straight-line distance from Apa`a St.Hazard Analysis:
[Lava flow] The June 27th lava flow from the Pu‘u ‘Ō‘ō vent is active, and lava is being supplied to the flow front, which is slowly advancing downslope toward Pāhoa.Remarks: The Pu‘u ‘Ō‘ō vent in the East Rift Zone of Kīlauea Volcano began erupting on January 3, 1983, and has continued erupting for more than 31 years, with the majority of lava flows advancing to the south. Over the past two years, lava flows have issued from the vent toward the northeast. The June 27th flow is the most recent of these flows and the first to threaten a residential area since 2010-2011. On June 27, 2014, new vents opened on the northeast flank of the Pu‘u ‘Ō‘ō cone and fed a narrow lava flow to the east-northeast. On August 18, the flow entered a ground crack, traveled underground for several days, then resurfaced to form a small lava pad. This sequence was repeated three more times over the following days with lava entering and filling other cracks before reappearing at the surface, in two of the cases farther downslope. Lava emerged from the last crack on September 6, forming a surface flow that initially moved to the north, then to the northeast, at a rate of 400 m/day (437 yd). The flow slowed thereafter and, between September 12 and 19, the rate of advancement varied, averaging 225 m/day (246 yd). The flow front stalled by September 22, but new breakouts upslope overtook the stalled front on September 29. During the past 2 weeks, advance rates of the flow front have varied between about 120 m/day (131 yd) and 60 m/day (65 yd). USGS Hawaiian Volcano Observatory on Oct. 12
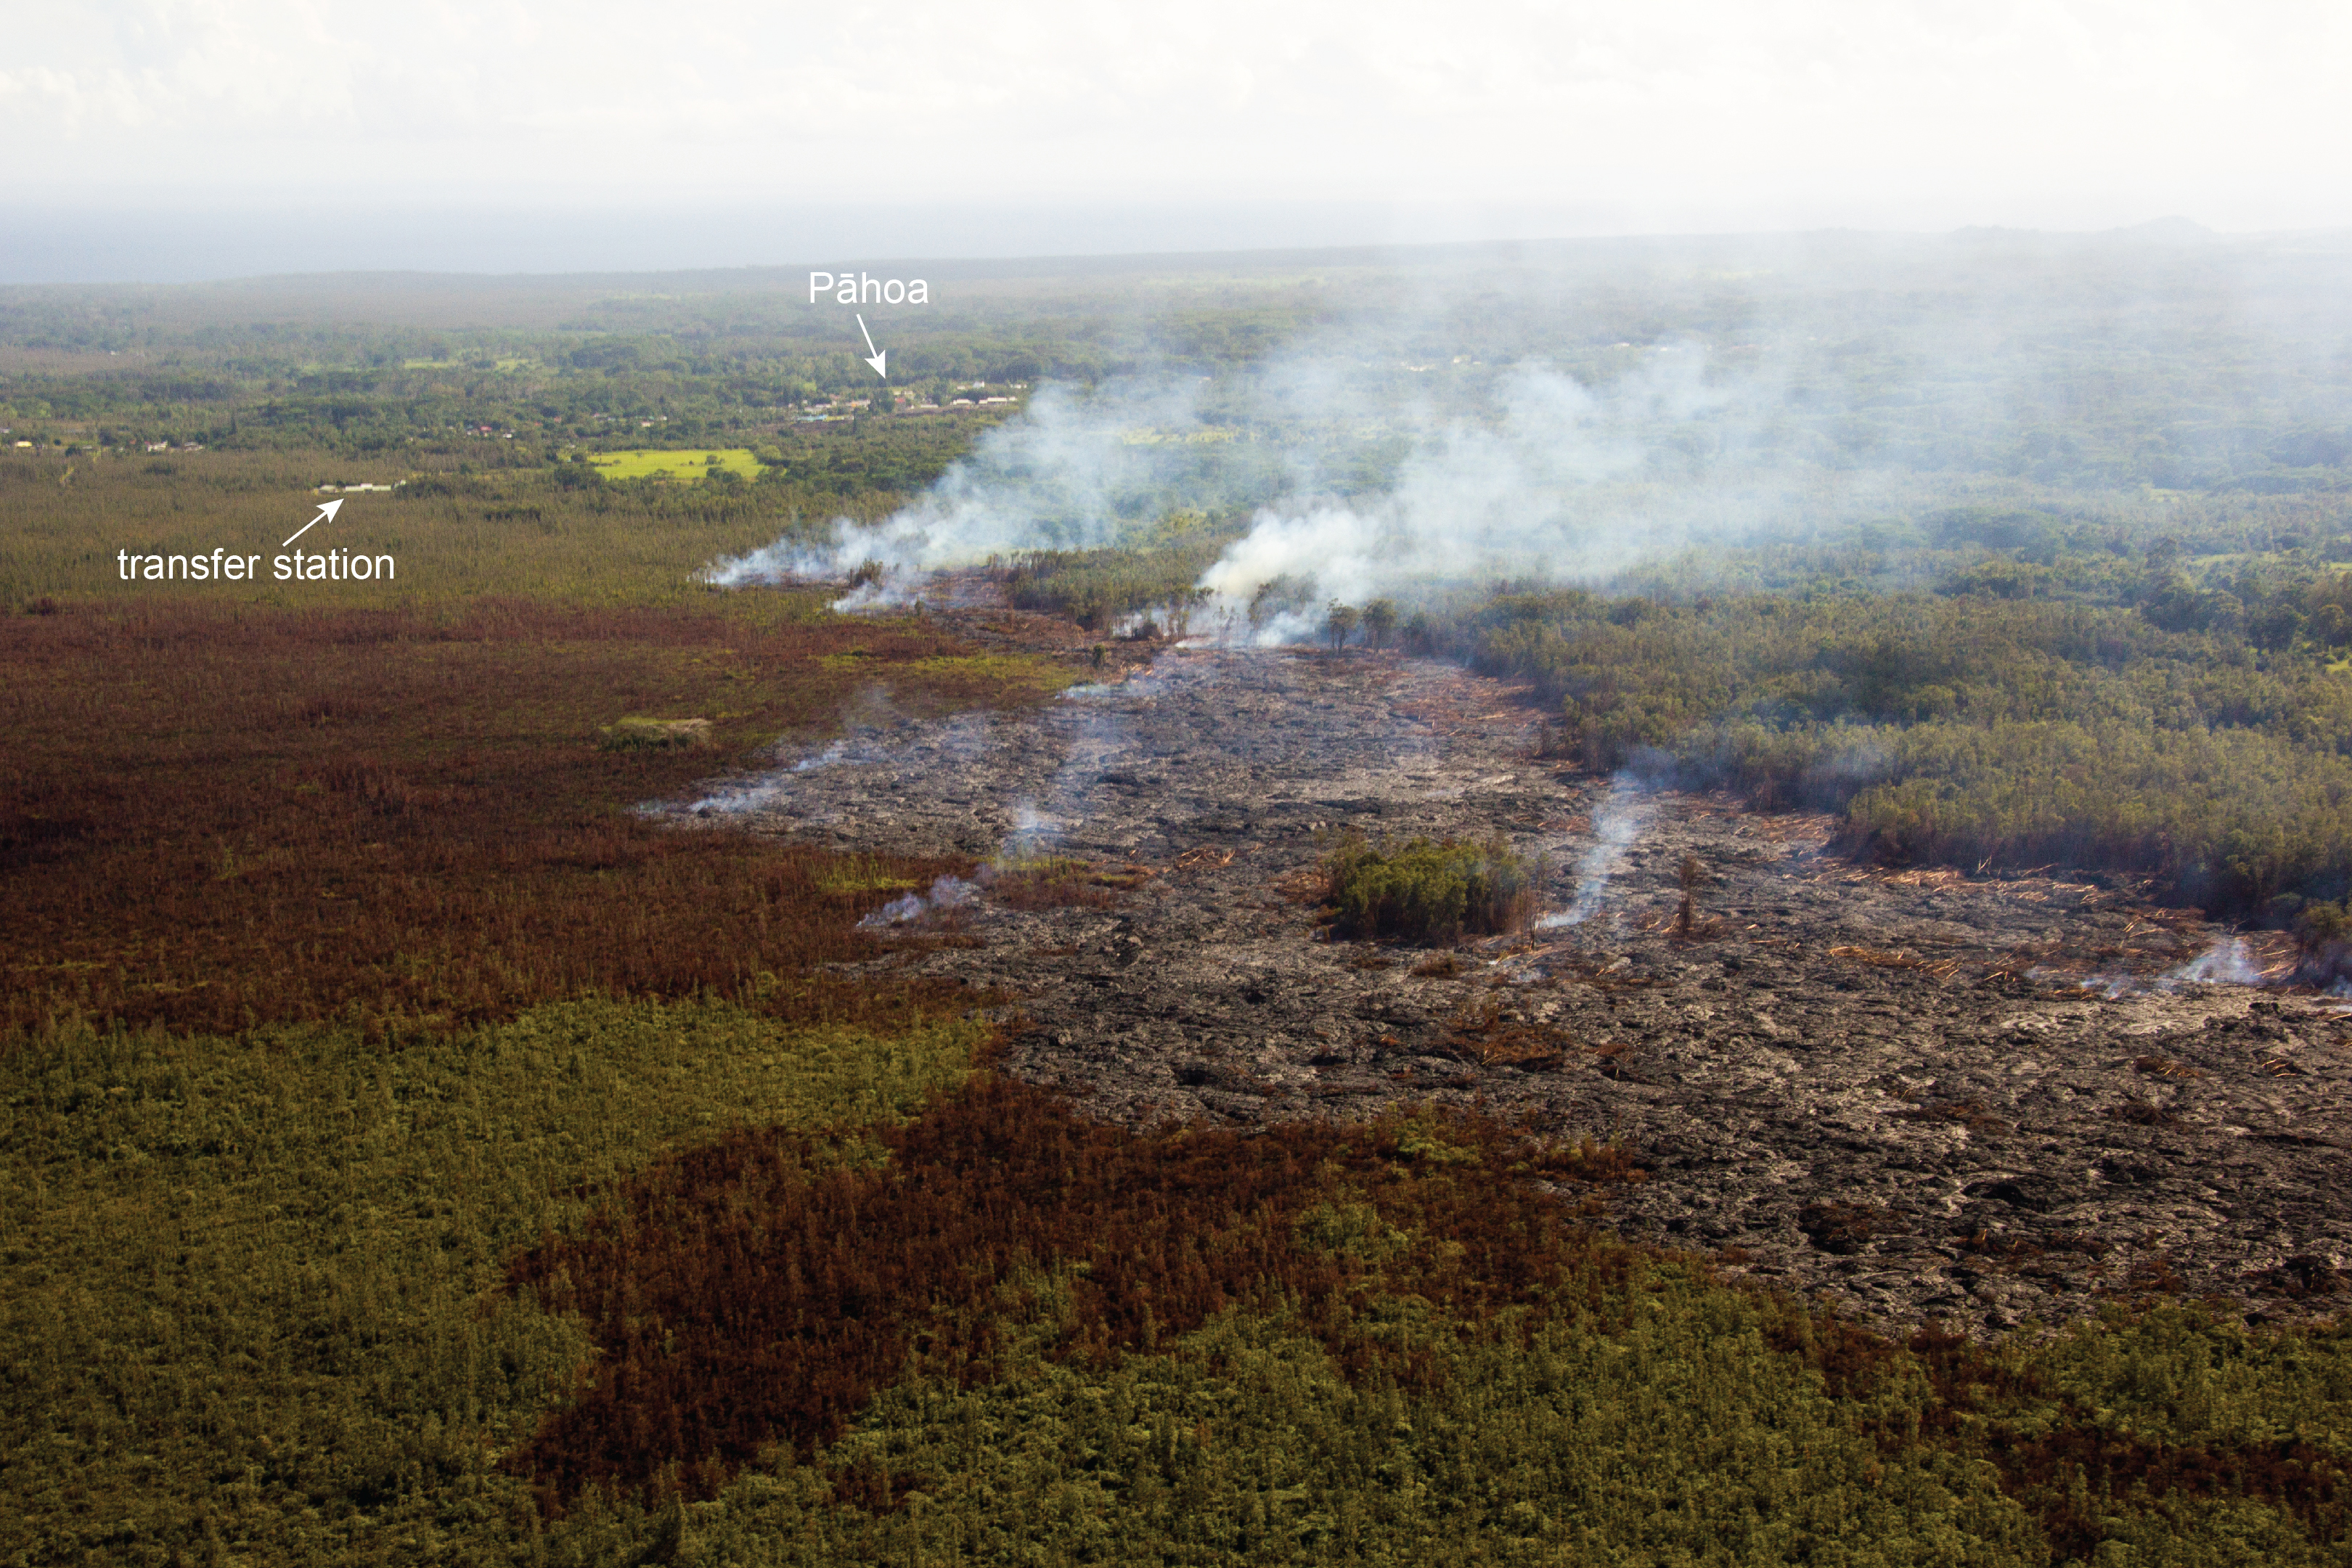
This USGS photo, looking down flow and taken at a low altitude, shows the flow front direction relative to the transfer station and Pāhoa.
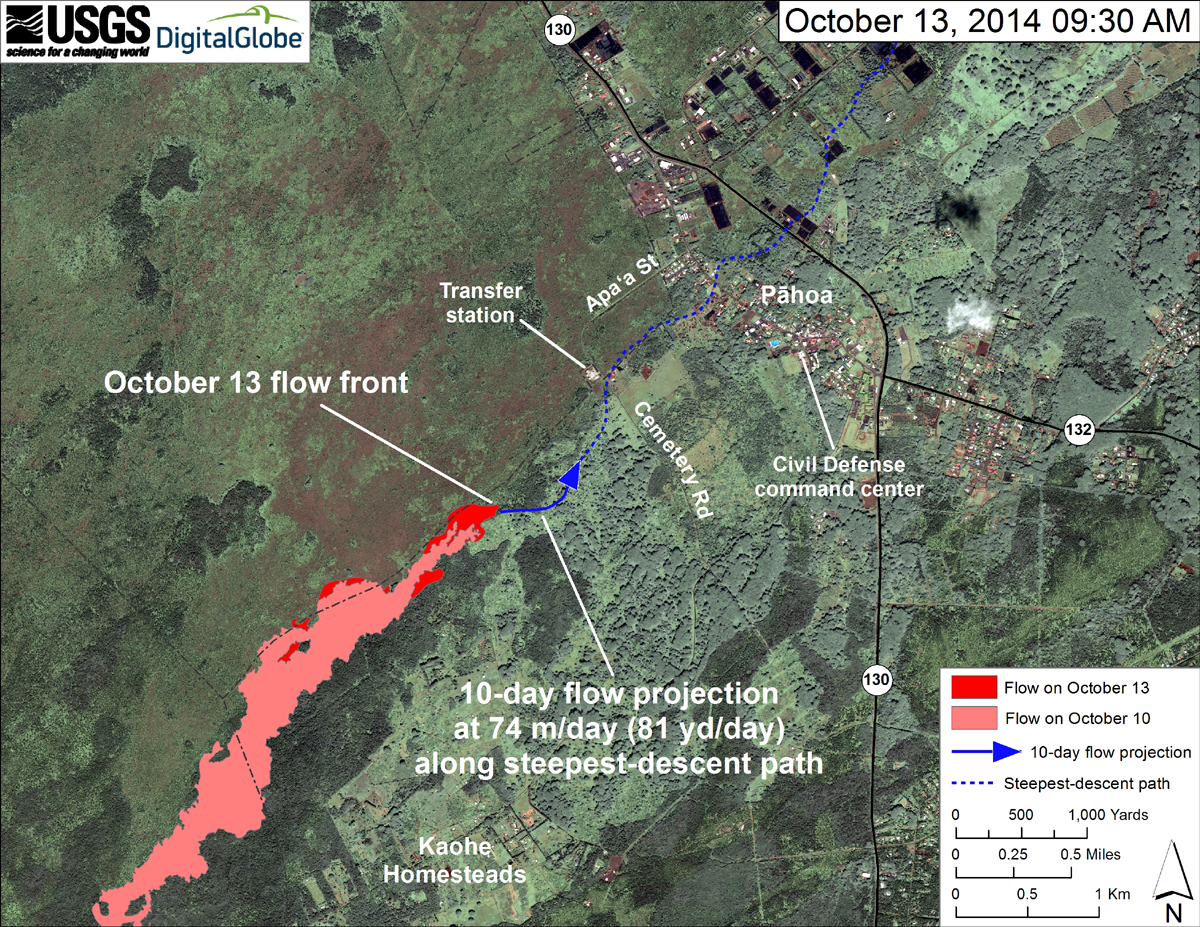
This map uses a satellite image acquired in March 2014 (provided by Digital Globe) as a base to show the area around the front of the June 27th lava flow. The area of the flow on October 10, 2014, at 10:30 AM is shown in pink, while widening and advancement of the flow as mapped on October 13 at 9:30 AM is shown in red. The flow front advanced about 220 m (240 yd) since our October 10, 2014, overflight. This puts the flow front about 1.1 km (0.7 mi) upslope from the closest point along Apaʻa Street (Cemetery Road), as measured in a straight line, or about 1.4 km (0.9 mi) measured along the path of steepest-descent that the flow is currently following.
The solid blue line with the arrowhead shows the projected path of the flow over the next 10 days (to October 23), based on the steepest-descent path and the average advance rate of 74 m/day (81 yd/day) calculated for the period since October 6. The amount of lava erupted from the June 27th vent, and the advance rate of the resulting lava flow, have been variable. The flow could speed up or slow down; the flow front could stall again, and a new active flow front could start again farther upslope; or the flow could stop altogether. Thus, this projection is subject to change.
The dotted blue line shows the steepest-descent path, calculated from a 1983 digital elevation model (DEM; for calculation details, see http://pubs.usgs.gov/of/2007/1264/), that the flow is projected to follow. Steepest-descent path analysis is based on the assumption that the DEM perfectly represents the earth’s surface. DEMs, however, are not perfect, so the dotted blue line can be used to infer only an approximate flow path.

by Big Island Video News
on at
STORY SUMMARY
USGS issues a Volcanic Activity Notice for Monday night, along with new photos and maps.