(ABOVE PHOTO) Photo showing the June 27 lava flow in relation to Apa’a Street, courtesy USGS Hawaiian Volcano Observatory.
NEWS BRIEFS
- The narrow finger that located behind the leading edge of the flow on its north has advanced approximately 60 yards and is now the leading edge. Civil Defense says no evacuation is needed at this time.
- Smoke conditions produced by burning vegetation in direct contact with the lava were moderate to heavy this morning in the Kaohe Homesteads area due to a light northwest wind, civil defense reports.
PRIMARY SOURCES

This morning’s assessment shows that the narrow finger or breakout that was noted along the north side of the flow front and located behind or further back from the leading edge of the flow has advanced approximately 60 yards and is now the leading edge or most forward and down slope area of flow activity. The original flow front continues to be active however has slowed. All burning activity is limited to vegetation that is in direct contact with the flow and smoke conditions were moderate to heavy this morning in the Kaohe Homesteads area due to a light northwest wind.
Current flow activity continues to move in a northeast direction and does not pose an immediate threat to area communities and no evacuation is needed at this time. Area residents will be given adequate notice to safely evacuate should that be necessary.
The public is reminded that the flow is not visible and cannot be accessed from any public areas. Access to the Kaohe Homesteads subdivision will remain restricted to area residents only.
We would like to thank everyone for your patience and understanding and your cooperation and assistance is greatly appreciated.Hawaii County Civil Defense on Oct. 12

Activity along the June 27th lava flow continues, with lava moving through the tube from Puʻu ʻŌʻō to the flow front. This morning’s Civil Defense over flight observed that the finger on the north side of the flow front has advanced approximately 55 meters (60 yards) and has become the leading edge of the flow. The original flow front continues to be active, however has slowed. Vegetation in direct contact with the flow is burning.
Puʻu ʻŌʻō Observations: There has been a small amount of deflationary ground tilt at Puʻu ʻŌʻō over the past day, within the normal range of observed tilt changes at this location. Glow was visible overnight above several outgassing openings in the crater floor. The most recent sulfur-dioxide emission-rate measurement for the East Rift Zone was 450 tonnes per day (from all sources) on October 9, 2014. Seismic tremor has been low and constant.
Summit Observations: The deflationary ground tilt observed since Friday evening has slowed over the past 24 hours, with little significant change in ground tilt observed since early this morning. There was no major change in seismicity on Kīlauea over the past day.USGS Hawaiian Volcano Observatory on Oct. 12
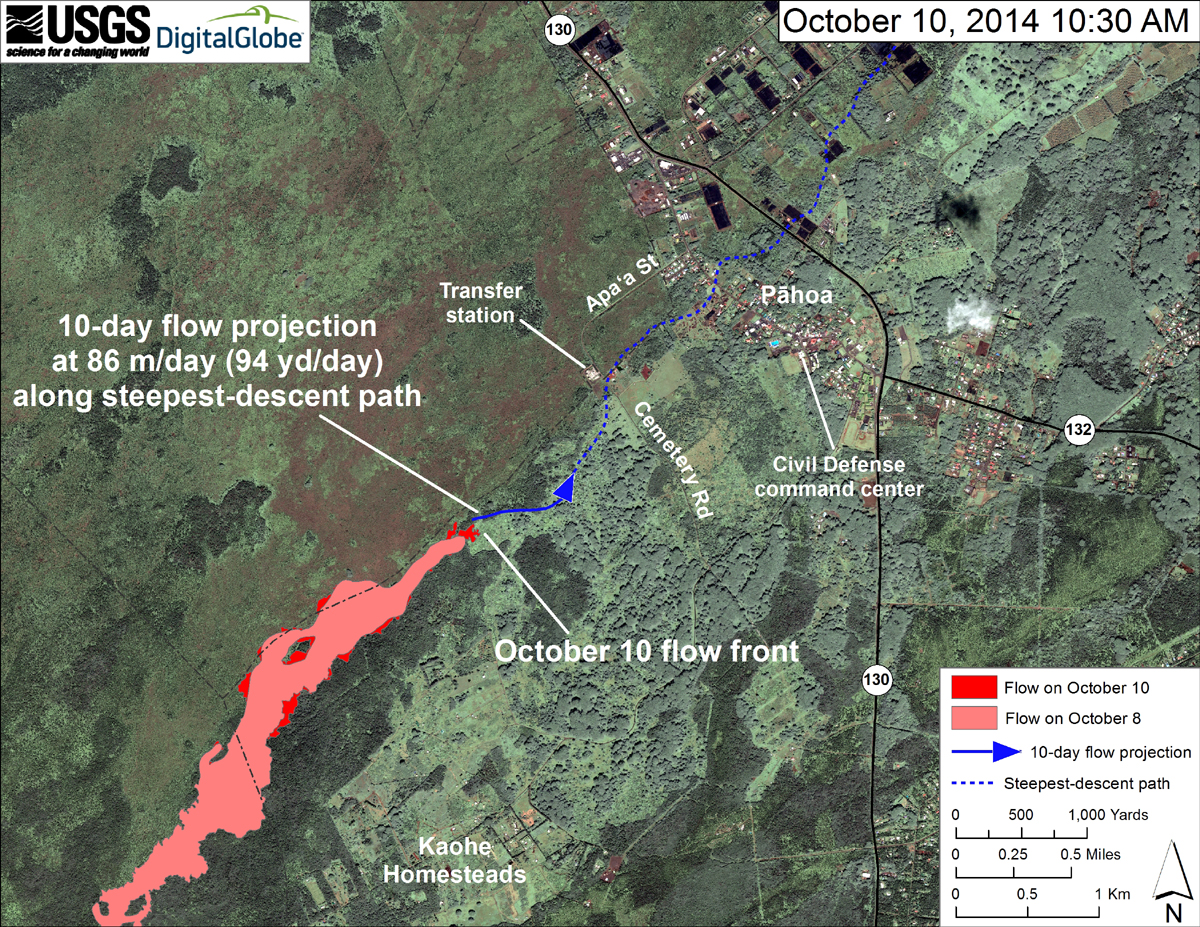
From USGS HVO: This map uses a satellite image acquired in March 2014 (provided by Digital Globe) as a base to show the area around the front of the June 27th lava flow. The area of the flow on October 8, 2014, at 10:20 AM is shown in pink, while widening and advancement of the flow as mapped on October 10 at 10:30 AM is shown in red. Most of the changes to the flow margins just upslope from the flow front are due to more precise mapping today, rather than actual flow widening. The flow front advanced about 115 m (126 yd) since our October 8, 2014, overflight. This puts the flow front about 1.3 km (0.8 mi) upslope from the closest point along Apaʻa Street, as measured in a straight line, or about 1.6 km (1.0 mi) measured along the projected path of steepest-descent.
The solid blue line with the arrowhead shows the projected path of the flow over the next 10 days (to October 20), based on the steepest-descent path and the average advance rate of 86 m/day (94 yd/day) calculated for the period since October 3. The amount of lava erupted from the June 27th vent, and the advance rate of the resulting lava flow, have been variable. The flow could speed up or slow down; the flow front could stall again, and a new active flow front could start again farther upslope; or the flow could stop altogether. Thus, this projection is subject to change.
The dotted blue line shows the steepest-descent path, calculated from a 1983 digital elevation model (DEM; for calculation details, see http://pubs.usgs.gov/of/2007/1264/), that the flow is projected to follow. Steepest-descent path analysis is based on the assumption that the DEM perfectly represents the earth’s surface. DEMs, however, are not perfect, so the dotted blue line can be used to infer only an approximate flow path.

by Big Island Video News
on at
STORY SUMMARY
A lava finger behind the leading edge of the flow has advanced 60 yards and is now the leading edge.